- Home
- Management
- Research & Monitoring
- Management Strategy Evaluation
Management Strategy Evaluation
At its 89th Annual Meeting in 2013, the Commission endorsed the development of a program of Management Strategy Evaluation (MSE) for the Pacific halibut (Hippoglossus stenolepis) resource occurring within the Convention Area. In doing so, the Commission approved the formation of a Management Strategy Advisory Board (MSAB), tasked with overseeing and advising the IPHC Secretariat staff on the Management Strategy Evaluation (MSE) process.
What is Management Strategy Evaluation?
Management Strategy Evaluation (MSE) is a process to evaluate the consequences of alternative management options, known as harvest strategies. MSE uses a simulation tool to determine how alternative harvest strategies perform given a set of pre-defined fishery and conservation objectives, taking into account the uncertainties in the system and how likely candidate harvest strategies are to achieve the chosen management objectives.
MSE is a simulation technique based on modelling each part of a management cycle. The MSE uses an operating model to simulate the entire population and all fisheries, factoring in management decisions, the monitoring program, the estimation model, and potential ecosystem effects using a closed-loop simulation.
Undertaking a MSE has the advantage of being able to reveal the trade-offs among a range of possible management decisions. Specifically, to provide the information on which to base a rational decision, given objectives, preferences, and attitudes to risk. The MSE is an essential part of the process of developing and agreeing to a harvest strategy.
The MSE process involves:
- Defining fishery and conservation objectives with the involvement of stakeholders and managers;
- Identifying harvest strategies (a.k.a. management procedures) to evaluate;
- Simulating a Pacific halibut population using those harvest strategies;
- Evaluating and presenting the results in a way that examines trade-offs between objectives;
- Applying a chosen harvest strategy;
- Repeating this process in the future in case of changes in objectives, assumptions, or expectations.
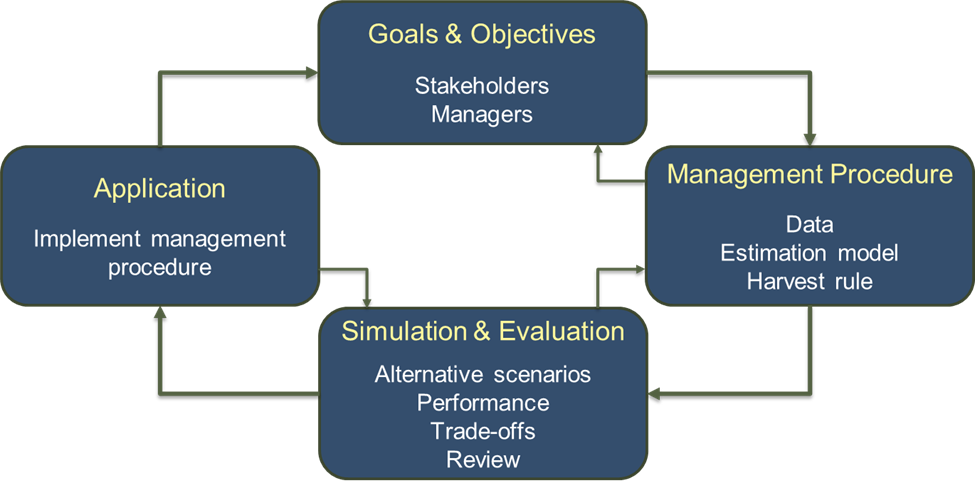
Figure 1: The general process of management strategy evaluation.
Undertaking an MSE requires scientists, managers, and stakeholders to be involved throughout the process. While the scientists do the modelling, managers must offer extensive input. Because of the many steps and the iterative process, communication among parties is critical for achieving buy-in on the results of the management strategy evaluation.
Current MSE documents:
External peer review |
||||
---|---|---|---|---|
At the 95th Session of the IPHC Annual Meeting (AM095) in January 2019, the Commission agreed to implement an additional process of external peer review of the IPHC Management Strategy Evaluation process over the course of 2019/20. The following is a list of key documents relating to the 2020 independent peer review: |
||||
Document | Title | PPT | Availability | |
IPHC-2020-MSEPeerReview | Independent peer review of the 2020 IPHC Management Strategy Evaluation process - Prepared by Assoc. Prof. Dr Trevor Branch |
![]() |
25 Sept 2020 |
Harvest Strategy Policy |
||||
---|---|---|---|---|
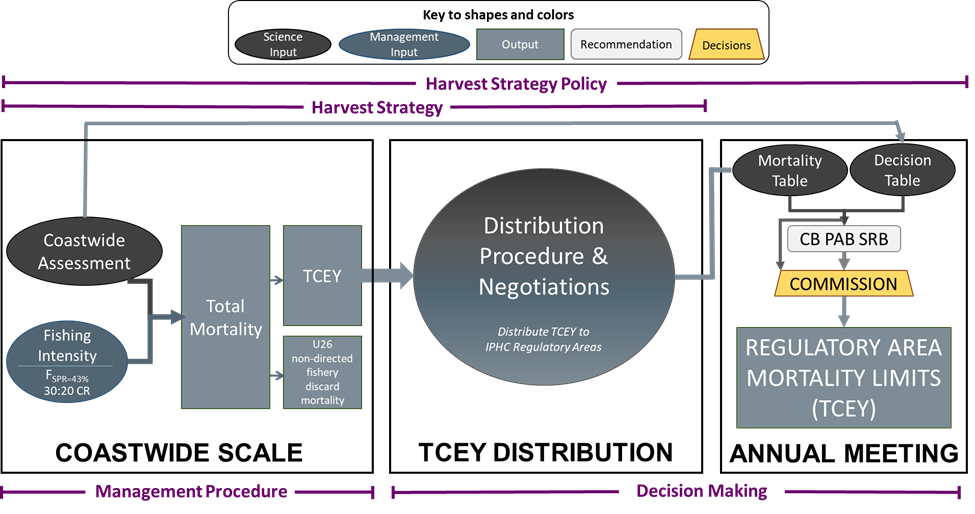
The current interim management procedure in the IPHC harvest strategy policy contains two distinct components (Figure 2). The first is related to coastwide scale and determines the overall coastwide mortality on the Pacific halibut stock. The second is the distribution of coastwide mortality (TCEY) to the IPHC Regulatory Areas. Catch sharing plans and other agreements determine how the TCEY is allocated among the fishery sectors within an IPHC Regulatory Area. The framework for the harvest strategy policy is described in the harvest strategy policy document and the current interim harvest policy is described here. Figure 2: An illustration of the current interim IPHC harvest strategy policy process showing the coastwide scale and TCEY distribution components that comprise the management procedure. The decision component is the Commission decision-making procedure, which considers inputs from many sources. |
MSE Framework |
|||||||||||||||||||
---|---|---|---|---|---|---|---|---|---|---|---|---|---|---|---|---|---|---|---|
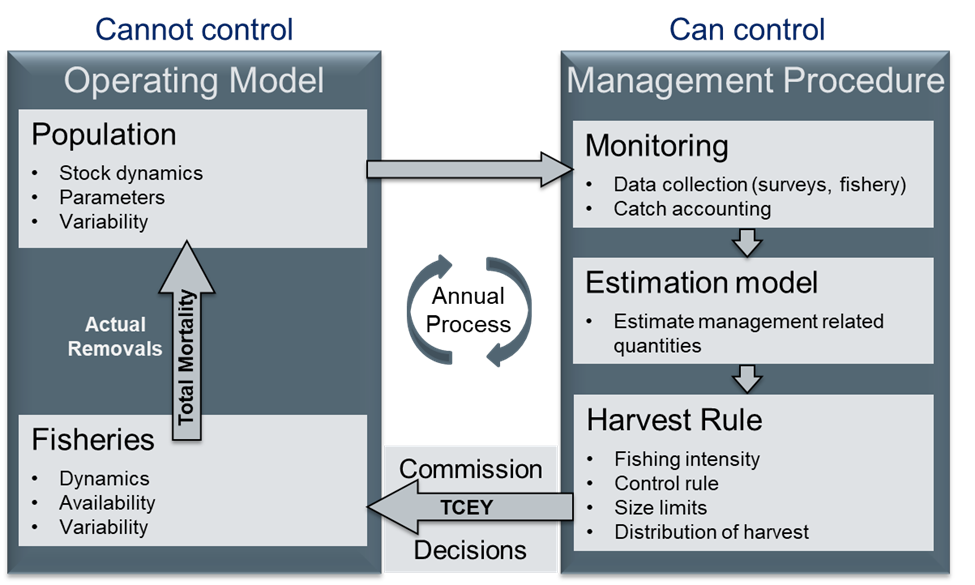
The MSE framework is the implementation of the MSE process including the interplay between the main elements of an MSE (i.e., objectives, management procedures, simulation, evaluation, and application as seen in Figure 1) as well as the components within each of those main elements. A major part of the framework is linking a management procedure to the operating model with a closed-loop feedback (Figure 3). The operating model simulates the Pacific halibut population and the fishery, and consists of processes that are not controlled through management. The population and fishery dynamics are specified with mathematical models and uncertainty is a major consideration. Different hypotheses about how the dynamics operate are commonly included in the simulations, which may result in multiple operating models that are specified differently from each other. Operating models are conditioned to data to ensure that they are the best possible depiction of the Pacific halibut population. The management procedure consists of three elements (Figure 3). Monitoring (data generation) represents the collection of data from the fisheries and population (i.e., operating model) that are used by the estimation model and harvest rule to determine management outputs. Data are simulated in the framework to represent the data collection and sampling process, which may include variability and bias. These data are used by the estimation model to estimate management related quantities to use in the harvest rule. The estimation model may be as simple as using observations of past catches, may be more complex by using the outputs of a fishery-independent survey, or may be as complex as the current ensemble stock assessment which integrates data from multiple sources. The estimation model is subject to estimation error, meaning that it is an uncertain estimate of the management quantities. The harvest rule is the application of the estimation model output in a procedure (Figure 2) that results in catch limits for Pacific halibut in each IPHC Regulatory Area. The management procedure consists of predetermined steps with a predictable outcome that can be modelled in a computer simulation and is applied consistently year after year. Figure 3: The closed-loop feedback between the operating model and a management procedure. A generalized framework has been developed by the IPHC Secretariat for current analyses of management procedures related to scale and distribution components of the harvest strategy policy, and will also be useful for future analyses as determined by the Commission. Technical details of the MSE framework are provided in the MSE Technical document. |
|||||||||||||||||||
Document | Title | PPT | Availability | ||||||||||||||||
IPHC-2021-MSE-01 | Technical Details of the IPHC MSE Framework | ![]() |
19 May 2021 |
Operating Model |
||||
---|---|---|---|---|
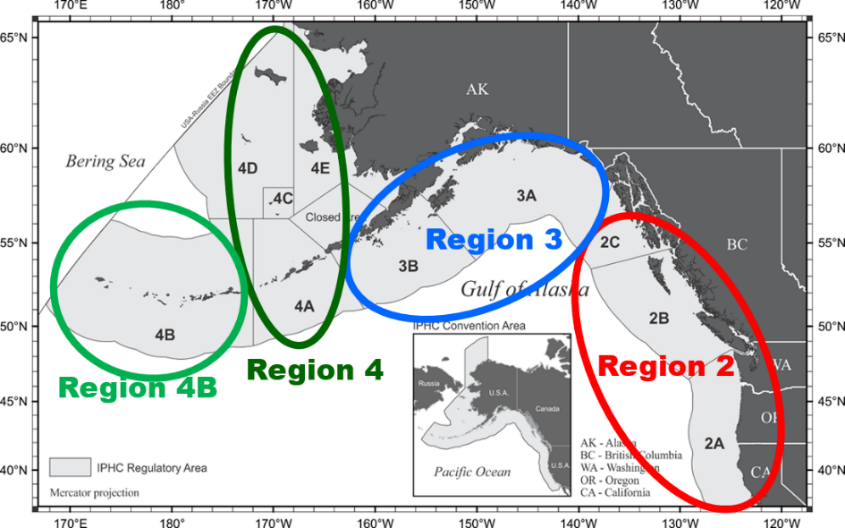
Coastwide Operating Model For the simulations to investigate the scale component of the harvest strategy policy (Figure 2), the stock synthesis (Methot and Wetzel 2013) assessment software was used as an operating model. This platform is currently used for the stock assessment, and the operating model was comprised of the two coastwide assessment models (short and long time-series) currently used in the stock assessment ensemble. The current ensemble is composed of four different assessment models, and includes a cross between coastwide or areas-as-fleets structuring of the data, and the length of the time series (short or long). Using an areas-as-fleets operating model would require generating data and distributing catch to four areas of the coast, which would involve many assumptions. In addition, without a multi-area model, there would not be feedback from migration and productivity of harvesting in different areas. Therefore, only the two coastwide models were used, but with additional variability. These models are structured to use five general sources of mortality (these are aggregated for modelling purposes and do not necessarily correspond to specific fisheries or sectors): the directed commercial halibut fishery (including research landings), directed fishery discard mortality (previously known as wastage), non-directed fishery mortality (previously referred to as bycatch), recreational, and subsistence. The simulated Total Mortality (TM) was distributed to each source in an ad-hoc manner using current available information along with guidance from the MSAB. Multi-area Operating Model A multi-area operating model has been developed by the IPHC Secretariat and includes key components relative to halibut ecology, specifically movement, as well fisheries within each IPHC Regulatory Area. A first element is the modelling of halibut biology by biological regions (Figure 4). Pacific halibut within the same biological region share common biological traits, and tagging studies have shown that Pacific halibut tend to remain within the same biological region during the year, while movement across regions occurs from one year to the next. This simplification reduces the modelling complexity and eliminates the need to parameterize intra-annual movements. A second element is the modelling of movement between regions by means of transition matrices: tagging studies as well as information relative to spawning and feeding grounds will inform the development of these transition matrices. The operating model is implemented in the C++ programming language, and despite being developed specifically for Pacific halibut, it is flexible enough for use with different species. Figure 4: Biological Regions overlaid on IPHC Regulatory Areas with Region 2 comprised of 2A, 2B, and 2C, Region 3 comprised of 3A and 3B, Region 4 comprised of 4A and 4CDE, and Region 4B comprised solely of 4B. Methot, R.D., and Wetzel, C.R. 2013. Stock synthesis: A biological and statistical framework for fish stock assessment and fishery management. Fish. Res. 142(0): 86-99. http://dx.doi.org/10.1016/j.fishres.2012.10.012 |
Goals and Objectives |
||||
---|---|---|---|---|
One of the key steps in the MSE process is the definition of management objectives related to stock conservation and fishery outcomes. Each objective is quantitatively represented using a performance metric, which is the statistic considered when evaluating the performance of different management procedures. Objectives are defined through the interaction with stakeholders: at IPHC, the process has been guided by the MSAB. MSAB, with the support of the IPHC Secretariat, has initially defined four overarching goals: 1) biological sustainability, 2) optimize directed fishing opportunities, 3) minimize discard mortality in directed fisheries, and 4) minimize discards and discard mortality in non-directed fisheries. For the first two goals, primary coastwide objectives and area-specific objectives have been identified (Table 1) under four general categories: i) biological sustainability, ii) optimize fishing activities, iii) limit catch variability and iv) provide directed fishing yield. Most of these categories have both coastwide and area-specific objectives. Coastwide scale objectives: i) Biological sustainability: maintain the female relative spawning biomass (RSB) above 20% current conditions at least 95% of the time. ii) Optimize fishing activities: maintain the relative spawning biomass (RSB) above a target of RSB36% at least 50% of the time. Based on dynamic reference points analysis conducted by the IPHC Secretariat, this target was determined as a reasonable proxy that optimizes fishing activities. iii) Limit catch variability: catch variability is defined by two different concepts, i.e. Annual Change (AC), which is the change in TCEY from one year to the next, and the Average Annual Variability (AAV), which is the average percent change taken over a 10 year period. The performance metrics reported are the probability of the AC being higher than 15% in any three years out of ten, and the median AAV. Management procedures will be evaluated against this objective by looking at tradeoffs between these and other performance metrics. iv) Provide directed fishing yield: optimize the average coastwide TCEY to maintain an adequate fishing level. Management procedures will be evaluated against this objective by looking at tradeoffs between the average TCEY and other performance metrics. Objectives related to distribution of the TCEY: i) Biological sustainability: conserve spatial population structure maintaining a minimum proportion of spawning biomass in each biological region. The IPHC Secretariat proposed minimum proportions of 5%, 33%, 10%, and 2% for Biological Regions 2, 3, 4, and 4B, respectively, to be maintained at least 95% of the time, after qualitatively investigating the modelled survey proportions of O32 stock distribution in each biological region since 1993 (the earliest period for which this information is available). This objective will be revisited in the future as more information becomes available. ii) Limit catch variability: as per the coastwide objective, catch variability is defined by two different concepts, i.e. Annual Change (AC), which is the change in TCEY from one year to the next, and the Average Annual Variability (AAV), which is the average percent change taken over a 10 year period. The performance metrics reported are the probability of the AC being higher than 15% in any three years out of ten, and the median AAV for each IPHC Regulatory Area. Management procedures will be evaluated against this objective by looking at tradeoffs between these and other performance metrics. iii) Provide directed fishing yield: optimize the TCEY among IPHC Regulatory Areas and guarantee a minimum TCEY for each IPHC Regulatory Area. The performance metrics reported are the median and minimum TCEYs by IPHC Regulatory Area, and the median and minimum percentage of the coastwide TCEY in each IPHC Regulatory Area. Management procedures will be evaluated against this objectives by looking at tradeoffs between these and other performance metrics. Table 1: Primary measurable objectives, evaluated over a simulated ten-year period. Objective 1.1 is a biological sustainability objective and objectives 2.1, 2.2, and 2.3 are fishery objectives. |
Management Procedures |
||||
---|---|---|---|---|
Management procedures (MPs) are the combination of data collection programs, data analysis, and elements of a harvest control rule that specify the procedure for determining management actions for a specific fishery. The MSE process is aimed at evaluating the performance of different management procedures against specific objectives. The management procedure at IPHC is composed of two major elements: the scale component that defines the coastwide total mortality, and the distribution component that defines the distribution of the TCEY to IPHC Regulatory Areas. For the interim harvest strategy policy, the coastwide scale component uses a harvest control rule with a fishery trigger and a fishery limit to linearly reduce the fishing intensity, which is measured using spawning potential ratio (SPR, Figure 5). The fishing intensity begins to be reduced when the relative spawning biomass (RSB) is estimated below 30% (i.e., fishery trigger) and is set equal to 0 (SPR=100%) if the relative spawning biomass is estimated below 20% (fishery limit). The stock assessment determines the projected total mortality corresponding to a reference fishing intensity (the fishing mortality that would reduce the SPR in the coastwide stock to the reference level in the long-term). The TCEY is determined from this total mortality by subtracting coastwide under 26 inch (U26) non-directed fishery discard mortality and is then distributed among IPHC Regulatory Areas. Currently, Weight-Per-Unit-Effort (WPUE) estimated from a space-time model using IPHC fishery-independent setline survey (FISS) data is used to determine the stock distribution among IPHC Regulatory Areas. The target distribution of the TCEY is shifted from the estimated stock distribution based on relative harvest rates of 1.00 for IPHC Regulatory Areas 2A–3A and 0.75 for IPHC Regulatory Areas 3B–4CDE based on assumptions of differences in productivity, presence of small fish, differences in emigration and immigration, and potential greater uncertainty in the data from western areas. Recently, an agreement was made to set the TCEY at 1.65 M lbs (748 mt) for IPHC Regulatory Area 2A and at a calculated proportion of the coastwide TCEY for IPHC Regulatory Area 2B (IPHC-2020-AM096-R, paragraphs 97b and c). The TCEY in other IPHC Regulatory Areas are scaled appropriately to maintain the total coastwide TCEY. Figure 5: Example harvest control rule responsive to stock status based on Spawning Potential Ratio (SPR) to determine applied fishing intensity (vertical axis). A fishery trigger level based on stock status determines when the fishing intensity begins to be linearly reduced, and a fishery limit based on stock status determines when there is theoretically no fishing intensity (SPR=100%). Quantities potentially related to objectives (biomass limit, and biomass target) may or may not align with the control points in the management procedure. The MSE process has investigated alternative management procedures incorporating scale and distribution that were considered by the Commission at the 97th Annual Meeting (AM097) in 2021. At the coastwide level, different levels of fishing intensity were evaluated with a 30:20 control. Possible constraints on the annual change in the TCEY, include limiting the annual change to no more than 15%, were also considered. A framework has been developed for the distribution component that may or may not first distribute the coastwide TCEY to Biological Regions (Figure 4) before distributing it to IPHC Regulatory Areas. Many tools have been identified for inclusion in the framework and eleven management procedures were applied to simulations to evaluate against objectives (Table 2 below). Table 2: Recommended management procedures to be evaluated by the MSAB in 2020 and the priority of investigation. A priority of 1 denotes a focus on producing precise performance metrics. A priority of 2 denotes potentially fewer simulations are desired, if time is constrained.
|
Current Results |
||||
---|---|---|---|---|
Coastwide MSE Using a closed-loop simulation framework, SPR values from 30% to 56% (higher SPR translates to lower fishing intensity) were evaluated along with a 40:20, 30:20, 25:10, and no harvest control rule, where the fishing intensity decreases linearly between the two relative spawning biomass (RSB) values (fishery trigger : fishery limit) and is set to 0 when the RSB level is lower than the fishery limit. Each control rule was tested with and without constraints (i.e., a maximum annual change in the catch limit of 15% (‘maxChangeBoth15%’), an implemented annual change of 50% upwards and 33% downwards (‘slowUpFastDown’), and setting the catch limit every third year (‘multiYear’)). Long-term performance metrics from the coastwide investigation of fishing intensity showed little risk of falling below the 20% biomass limit for nearly all management procedures evaluated, except when no control rule was used. A procedural SPR value greater than 40% met the biomass target objective for all management procedures that used a 30:20 control rule. In the medium-term, variability in catches increased with higher fishing intensities (i.e., lower SPR), and only management procedures with a constraint met the stability objective. Median total mortality (TM) limits increased slightly with greater fishing intensity and the probability that the total mortality was less than 34 Mlbs (15,400 t) was minimized in the range of 40% to 46% for management procedures using a 30:20 control rule. The full results are available in IPHC-2020-AM096-12. Multi-region MSE The Management Strategy Evaluation (MSE) at the International Pacific Halibut Commission (IPHC) has developed a framework to investigate MPs related to distributing the Total Constant Exploitation Yield (TCEY) to IPHC Regulatory Areas and has completed an evaluation of management procedures (MPs) for the coastwide scale and TCEY distribution of the Pacific halibut stock and fishery. A four-region operating model was conditioned to match historical data and then simulated forward in time with uncertainty and applying eleven different management procedures (MPs), detailed in the Report of the 15th Session of the IPHC Management Strategy Advisory Board (MSAB015) and summarized above in Table 2, with various SPR values to determine distributed mortality limits. These MPs examined a coastwide constraint on the maximum annual change in the mortality limit, agreements for specific IPHC Regulatory Areas, methods for using observations of stock distribution, and applying differing relative harvest rates among IPHC Regulatory Areas. Many trade-offs between objectives and between IPHC Regulatory Areas were considered in the evaluation. Biological sustainability objectives were met for all MPs, except that the percentage of spawning biomass in IPHC Regulatory Area 4B was below the defined tolerance for all MPs. This particular result may be due to a number of factors, including a misspecification of the population dynamics in that Biological Region. Yield objectives were similar for coastwide performance metrics but varied across IPHC Regulatory Areas depending on the elements of the MPs. MPs were ranked higher with respect to stability objectives when methods to dampen variability, such as constraints on the annual change in the TCEY and averaging of stock distribution estimates, were included in the MP. Two MPs performed the best. One (MP-D) allowed for increases in the fishing intensity to accommodate agreements in 2A and 2B. The other (MP-J) used a moving five year average of stock distribution estimates to distribute the TCEY. A report of the MSE is available at IPHC-2021-AM097-11. All MSE results and visualizations to evaluate the MPs are available on the MSE Explorer online tool. |
Previous MSE Documents |
||||
---|---|---|---|---|
MSE documents from prior years: |
||||
Document | Title | PPT | Availability | |
IPHC-2021-MSE-01 | Technical Details of the IPHC MSE Framework | ![]() |
19 May 2021 |
Related: Harvest Strategy Policy