2019 Pacific Halibut Landings
If an error message appears, reload or refresh the page.
| *Last updated: 02 March 2020 | |||||||||||||||||||||||||||||||||||||||||||||||||||||
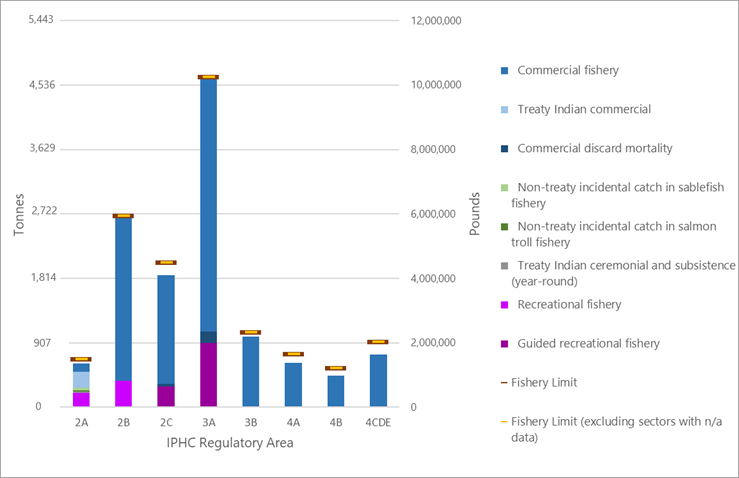
| IPHC Regulatory Area | Fishery limits (net weight) | Landings (net weight) | |||||||||||||||||||||||||||||||||||||||||||||||||||
| Tonnes (t) | Pounds (lb) | Tonnes (t) | Pounds (lb) | Pct (%) Landed | |||||||||||||||||||||||||||||||||||||||||||||||||
| Area 2A (California, Oregon, and Washington) | 680.39 | 1,500,000 | 612.62 | 1,350,604 | 90 | ||||||||||||||||||||||||||||||||||||||||||||||||
| Non-treaty directed commercial (south of Pt. Chehalis)* | 115.41 | 254,426 | 114.65 | 252,761 | 99 | ||||||||||||||||||||||||||||||||||||||||||||||||
| Non-treaty incidental catch in salmon troll fishery | 20.37 | 44,899 | 19.69 | 43,417 | 97 | ||||||||||||||||||||||||||||||||||||||||||||||||
| Non-treaty incidental catch in sablefish fishery (north of Pt. Chehalis) | 31.75 | 70,000 | 36.00 | 79,360 | 113 | ||||||||||||||||||||||||||||||||||||||||||||||||
| Treaty Indian commercial | 225.44 | 497,000 | 224.33 | 494,568 | 100 | ||||||||||||||||||||||||||||||||||||||||||||||||
| Treaty Indian ceremonial and subsistence (year-round) | 12.70 | 28,000 | 14.61 | 32,200 | 115 | ||||||||||||||||||||||||||||||||||||||||||||||||
| Recreational Washington | 125.69 | 277,100 | 122.48 | 270,024 | 97 | ||||||||||||||||||||||||||||||||||||||||||||||||
| Recreational Oregon | 131.35 | 289,575 | 72.71 | 160,306 | 55 | ||||||||||||||||||||||||||||||||||||||||||||||||
| Recreational California | 17.69 | 39,000 | 8.15 | 17,968 | 46 | ||||||||||||||||||||||||||||||||||||||||||||||||
| Area 2B (British Columbia) | 2,698.87 | 5,950,000 | 2,676.30 | 5,900,230 | 99 | ||||||||||||||||||||||||||||||||||||||||||||||||
| Commercial fishery | 2,313.32 | 5,100,000 | 2,304.77 | 5,081,145 | 100 | ||||||||||||||||||||||||||||||||||||||||||||||||
| Recreational fishery | 381.02 | 840,000 | 371.53 | 819,085 | 98 | ||||||||||||||||||||||||||||||||||||||||||||||||
| Area 2C (southeastern Alaska)1 | 2,036.63 | 4,490,000 | 1,860.92 | 4,102,622 | 91 | ||||||||||||||||||||||||||||||||||||||||||||||||
| Commercial fishery | 1,637.47 | 3,610,000 | 1,537.05 | 3,388,622 | 94 | ||||||||||||||||||||||||||||||||||||||||||||||||
| Commercial discard mortality | 27.22 | 60,000 | 36.29 | 80,000 | 133 | ||||||||||||||||||||||||||||||||||||||||||||||||
| Guided recreational fishery | 371.95 | 820,000 | 287.58 | 634,000 | 77 | ||||||||||||||||||||||||||||||||||||||||||||||||
| Area 3A (central Gulf of Alaska) | 4,653.86 | 10,260,000 | 4,649.64 | 10,250,699 | 100 | ||||||||||||||||||||||||||||||||||||||||||||||||
| Commercial fishery | 3,655.95 | 8,060,000 | 3,582.34 | 7,897,699 | 98 | ||||||||||||||||||||||||||||||||||||||||||||||||
| Commercial discard mortality | 140.61 | 310,000 | 160.12 | 353,000 | 114 | ||||||||||||||||||||||||||||||||||||||||||||||||
| Guided recreational fishery | 857.29 | 1,890,000 | 907.18 | 2,000,000 | 106 | ||||||||||||||||||||||||||||||||||||||||||||||||
| Area 3B (western Gulf of Alaska) | 1,056.87 | 2,330,000 | 995.44 | 2,194,580 | 94 | ||||||||||||||||||||||||||||||||||||||||||||||||
| Area 4A (eastern Aleutians) | 748.43 | 1,650,000 | 622.48 | 1,372,332 | 83 | ||||||||||||||||||||||||||||||||||||||||||||||||
| Area 4B (central/western Aleutians) | 548.85 | 1,210,000 | 443.50 | 977,742 | 81 | ||||||||||||||||||||||||||||||||||||||||||||||||
| Areas 4CDE2 and Closed | 925.33 | 2,040,000 | 744.72 | 1,641,820 | 80 | ||||||||||||||||||||||||||||||||||||||||||||||||
| Area 4C (Pribilof Islands) | 412.77 | 910,000 | n/a | n/a | n/a | ||||||||||||||||||||||||||||||||||||||||||||||||
| Area 4D (northwestern Bering Sea) | 412.77 | 910,000 | n/a | n/a | n/a | ||||||||||||||||||||||||||||||||||||||||||||||||
| Area 4E (Bering Sea flats) | 99.79 | 220,000 | n/a | n/a | n/a | ||||||||||||||||||||||||||||||||||||||||||||||||
| Total | 13,349.21 | 29,430,000 | 12,605.61 | 27,790,629 | 94 | ||||||||||||||||||||||||||||||||||||||||||||||||
| 1Does not include Metlakatla fishery. | |||||||||||||||||||||||||||||||||||||||||||||||||||||
| 2Landings in IPHC Regulatory Area 4CDE are combined to meet confidentiality requirements. | |||||||||||||||||||||||||||||||||||||||||||||||||||||
| n/a = not available | |||||||||||||||||||||||||||||||||||||||||||||||||||||
| Pacific Halibut Removals (pounds) by Fishery and IPHC Regulatory Area | |||||||||||||||||||||||||||||||||||||||||||||||||||||

|
|||||||||||||||||||||||||||||||||||||||||||||||||||||
Quota Share Commercial Fisheries
The 2019 quota share Pacific halibut fisheries opened on 15 March 2019. The following commercial landings, by weight and number of landings, have been reported from the Alaskan Individual Fishing Quota (IFQ) and Community Development Quota (CDQ) fisheries and from the British Columbian Individual Vessel Quota (IVQ) fishery to date.
| IPHC Regulatory Area | Fishery Limit | Landings | Proportion | Number of Landings | ||
| Tonnes | 000s lb | Tonnes | 000s lb | |||
| 2C | 1,637 | 3,610 | 1,537 | 3,389 | 93.88 | 1,251 |
| 3A | 3,656 | 8,060 | 3,582 | 7,898 | 97.99 | 1,491 |
| 3B | 1,057 | 2,330 | 995 | 2,195 | 94.21 | 305 |
| 4A | 748 | 1,650 | 622 | 1,372 | 83.15 | 212 |
| 4B | 549 | 1,210 | 443 | 978 | 80.83 | 87 |
| 4CDE | 925 | 2,040 | 221 | 1,642 | 80.49 | 772 |
| Alaska total | 8,573 | 18,900 | 7,926 | 17,473 | 92.45 | 4,118 |
| 2B (Canada) total | 2,313 | 5,100 | 2,305 | 5,081 | 99.63 | 692 |
| Grand Total | 10,886 | 24,000 | 10,230 | 22,554 | 93.98 | 4,810 |
| Last updated: 02 March 2020 | Totals may differ from area sums due to rounding | |||||
| Canada: The landings from IPHC Regulatory Area 2B (British Columbia) waters represent | ||||||
| ~100% of the 2019 commercial fishery limit. For comparison, 2,401 t, 5.3 Mlb, or ~100% of | ||||||
| the 2018 fishery limit, were landed from IPHC Regulatory Area 2B in 2018. | ||||||
| United States of America: The landings from IPHC Regulatory Areas 2C, 3, and 4 (Alaska) | ||||||
| represent ~92% of the 2019 commercial fishery limit. For comparison, 7,575 t, | ||||||
| 16.7 Mlb, or ~95% of the 2018 limit were landed in the Alaskan fishery in 2018. | ||||||
IPHC Regulatory Area 2A
IPHC Regulatory Area 2C
ANNETTE ISLANDS RESERVE FISHERY
The Metlakatla Indian Community has been authorized by the Government of the United States of America to conduct a commercial Pacific halibut fishery within the Annette Islands Reserve. The following table lists Pacific halibut catch and numbers of participating vessels by fishing period.

